The graph area can be divided in two parts.
-
The margin area
-
The plot area
These areas can have individual background colors as well as edges of user settable size and color. In addition it is possible to use an image as background with different formatting options.
The plot area is where the plot is drawn and the margin area is everything outside. Methods that affect the format of the plot area are
-
Graph::SetMargin(), This will adjust the size (and position) of the plot area -
Graph::SetBox($aDrawPlotFrame=true,$aPlotFrameColor=array(0,0,0),$aPlotFrameWeight=1), This will adjust tyhe format of the edge around the plot area. By default this is disabled.
In a similar way the margin areas peroperties can be adjusted with the methods
-
Graph::SetMargin(), same as above -
Graph::SetMarginColor($aColor) -
Graph::SetFram($aDrawImgFrame=true,$aImgFrameColor=array(0,0,0),$aImgFrameWeight=1) -
Graph::SetFrameBevel($aDepth=3,$aBorder=false,$aBorderColor='black',$aColor1='white@0.4',$aColor2='darkgray@0.4',$aFlg=true)
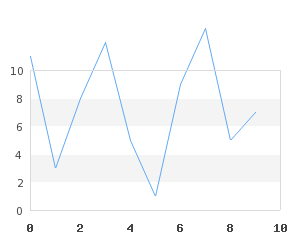
When auto scaling is used no data points will ever be outside the plot area
since the scaling will make sure it covers the dynamic range of the data.
However, when setting the scale manually there is always the risk that some data
points are outside the specified scale. This could then lead to the result shown
in Figure 14.13. Original plot without clipping ( To avoid this situation it is possible
to enable clipping to the plot region by calling the methodclipping_ex1.php)
-
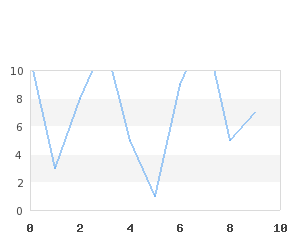
Graph::SetClipping($aFlg)
This will "cut away" all parts of the plot that would otherwise be stroked
outside the plot area.Figure 14.14. Plot with clipping enabled ( shows the result
after clipping has been enabled.clipping_ex2.php)
|
|
|
Note
By default clipping is disabled since it will slightly increase the CPU load and the time to generate the graphs.