As was mentioned above using StrokeCSIM() is very simple but it has
the drawback that it returns a single HTML page without any possibilities to add
additional text which makes its use fairly limited in real life situation where the
graph is part of a complex WEB-page. In this section we will discuss some best
practice to do this.
In principle there are two ways to do this
-
Store both the image map and the image in files which are later read back in the HTML page. This has the advantage of being simple but the drawback that it increases the processing time since writing and reading from a file takes time.
-
Avoiding the use of temporary file by mimicking the way
StrokeCSIM()works and od the stepsStrokeCSIM()does internally but in the script directly. In the remainder of this section we will show how this can be setup. That part will also introduce the methodStrokeCSIMImage()which is key to include CSIM graphs in HTML pages.
Caution
Some of the described methods in this section was added in version 2.5 of the library. In earlier versions more of this has to be done manually.
The library has been designed to make this as painless as possible but due to the way CSIM works there are some manual work that cannot be avoided. We will start slowly and in detail walk through an example where we include one CSIM graph in an arbitrary HTML page. There are a few things to keep in mind, the rest will be taken care of automatically by the library
-
In the HTML page the CSIM map must be semi-manually included. (It doesn't matter where)
-
The <img> tag for rendering the image must be semi-manually created
-
The original graph script needs a minor augmentation since it should no longer end by calling
StrokeCSIM() -
Some care needs to be taken to specify what the URL:s to be called should be
The library provides suitable functions for step 1 & 2 above so the only thing that needs to be done in the HTML page is calling these functions at suitable places. In principle the HTML page should have the structure shown in Example 10.1. Principles of including CSIM graph in a HTML page
Example 10.1. Principles of including CSIM graph in a HTML page
1 2 3 4 5 6 7 8 9 10 11 12 13 14 15 16 17 18 19 20 21 22 23 24 25 26 27 28 29 30 31 | <html> <body> // The name of the graph script file (change as needed!) $_graphfilename = 'mycsimgraph.php'; // This is the filename of this HTML file global $_wrapperfilename; $_wrapperfilename = basename (__FILE__); // Create a random mapname used to connect the image map with the image $_mapname = '__mapname'.rand(0,1000000).'__'; // This is the actual graph script require_once ($_graphfilename); // Get hold of the image map to include it in the HTML page $imgmap = $graph->GetHTMLImageMap($_mapname); echo $imgmap; <p>Some arbitrary HTML text .... </p> // We now create the <img> tag $imgtag = $graph->GetCSIMImgHTML($_mapname,$_graphfilename); echo $imgtag; </body> </html> |
Before we discuss the HTML code in detail lets first show what augmentation is needed in the graph script.
Normally the graph script will end with a call to either
Graph::Stroke() or Graph::StrokeCSIM(). However,
with CSIM style graph the complication is that we need to call the script twice.
Once to get the image map and once (in the final <img> tag) to actually
generate the image. In order to separate these two cases we make use of a URL
argument which will be used as a flag so that we know how to behave in the graph
script. In conjunction with HTML skeleton shown in Example 10.1. Principles of including CSIM graph in a HTML page we need to change the graph script so that
it instead uses the method Graph::StrokeCSIMImage() so that the
last line will be changed to
1 2 3 | ...
$graph->StrokeCSIMImage();
?> |
This method will only stroke the image when the "secret" flag is passed as a
URL argument (which will be added automatically when the <img> tag is
constructed in the call to GetCSIMImgHTML() . This means that the
first time this function gets called when we do the initial
require_once() in the top of the HTML page this method will do
nothing, which is exactly what we want since we only want to include the graph
script in order to be able to do the call to GetHTMLImageMap()
later down in the script.
We are now in position to discuss the HTML script above.
- Line 1-2
-
This is the standard HTML opening tags (by choice we keep this very simple and sloppy in these example.)
- Line 3-20
-
This is where we include the graph script. In addition we must also create a map name that will be used to connect an image map with the <img> tag. We have chosen to create a random name since the actual name is not significant. The only criteria is that the name must be unique if there are multiple maps in the same HTML page.
In addition we also record the name of the actual HTML page in the variable "
$wrapperfilename". This is so we can potentially use it as a target in the image script. We could then have targets that redisplays the same page but with potential additional or changed URL argument. - Line 21-22
-
This is just an illustration that it is possible to add arbitrary HTML markups and text on the page.
- Line 23-27
-
This is where we generate the needed <img> tag that should be included in the page. It is illustrative to view how the <img> tag actually looks.
1
2
<img src="mycsimgraph.php?_jpg_csimd=1" ismap="ismap"
usemap="#__mapname987066__" border="0" width="400" height="250" alt="" />
The name of the image is the specified graph name (which was given as the second argument). As can bee seen a URL argument "
flag _jpg_csimd=2" has been added. This is the "secret" flag that instructsStrokeCSIMImage()to actually send back the image. The second thing to notice is the map name. This is the random name we constructed that is used to connect to the map we wanted to use with this image. - Line 28-30
-
The closing HTML tags
What remains is to discuss how the actual CSIM targets in the graph script should be constructed. Again there are some choices to be made on what should happen when a user clicks on the gaph.
-
Clicking on a graph should open a "popup" window
-
Clicking on a graph should open the same HTML page but with some additional URL arguments
-
Clicking on a graph should open a fresh page in the browser
-
Clicking on the graph should open in an existing browser window
Earlier in this chapter we have shown how to handle case 1 so in the following
we will concentrate on cases 2-4. Before we start we need to discuss the third,
not yet mentioned, argument to the method SetCSIMTargets(). To
remind ourself this method is used on the various objects in a graph that can
act as hotspots. The full signature for this method is
1 | SetCSIMTargets($aURLTargets,$aAltTexts,$aWinTargets); |
The first argument specifies the URLs. Depending on the actual object this is either a string or an array of strings.
The second argument specified the HTML "alt" texts. In most browser this is shown as a popup text if the mouse pointer hovers over a hotspot area.
The final argument specifies the URL target window (where the link should open). Most browser recognizes a few special targets here
-
"_blank" . This will open the URL in a new browser window
-
"_top". Will break out of a frameset and display the target window at top
-
"" (empty). Will open the target in the current window
-
"namedWindow". Will open the target in the named window
In the discussions below we will assume that the graph is a basic barplot so the URLs we specify are connected to each individual bar in the plot and are specified with a call similar to
1 | $bplot->SetCSIMTargets($targets,$altnames,$wintargets) |
Case 2: Opening the same page but with some different URL arguments.
To do this we make use of the name of the HTML wrapper file we stored in
$_wrapperfilename . We can then construct the targets as shown
in Example 10.2. Creating CSIM URL targets to open in same browser window
Example 10.2. Creating CSIM URL targets to open in same browser window
1 2 3 4 5 6 7 8 9 10 11 12 13 14 | ... global $_wrapperfilename; $n = .. ; // Number of bars $targ = array(), $alt = array(); $wtarg = array(); for( $i=0; $i < $n; ++$i ) { $urlarg = urlencode( ... ); $targ[] = $_wrapperfilename.'?'.$urlarg; $alt[] = 'val=%d'; $wtarg[] = ''; } $bplot->SetCSIMTargets($targ,$alt,$wtarg); ... |
Caution
Remember to not include the "&" or the "=" used when constructing
the URL argument in the call to urlencode(). Otherwise they
will become part of the data and not separators in the URL argument
string.
Case 3: Open a fresh page in the browser
The following example opens the plain browser script in a fresh window. In
order to get hold of the script name we use the predefined PHP constant
__FILE__ . The target can of course be changed to any
URL.
Example 10.3. Creating CSIM URL targets to open in a fresh window
1 2 3 4 5 6 7 8 9 10 11 12 13 | ... $n = .. ; // Number of bars $targ = array(), $alt = array(); $wtarg = array(); for( $i=0; $i < $n; ++$i ) { $urlarg = urlencode( ... ); $targ[] = __FILE__.'?'.$urlarg; $alt[] = 'val=%d'; $wtarg[] = '_blank'; } $bplot->SetCSIMTargets($targ,$alt,$wtarg); ... |
Case 4: Open in an existing window/frame
By modifying the $wtarg[] line in the example above to
1 2 3 | $wtarg[] = ''; |
The target will open in the existing window.
In the "Example/" directory you can find the above a
fully working script as "csim_in_html_ex1.php" (HTML
script) and "csim_in_html_graph_ex1.php" (Graph
script).
Having laid the foundation for inclusion of CSIM graphs in Adding one CSIM graph in a HTML page it is now a simple exercise to extend this to include multiple CSIM graphs in the same HTML page. The only modifications we have to do is to make sure that:
-
Each image map has a unique name
-
The graph scripts must create unique instances of the main Graph class, i.e. they cannot both have an instance called "
$graph" -
Include each graph script in turn and get the corresponding HTML map
-
Get the proper image tag for each graph
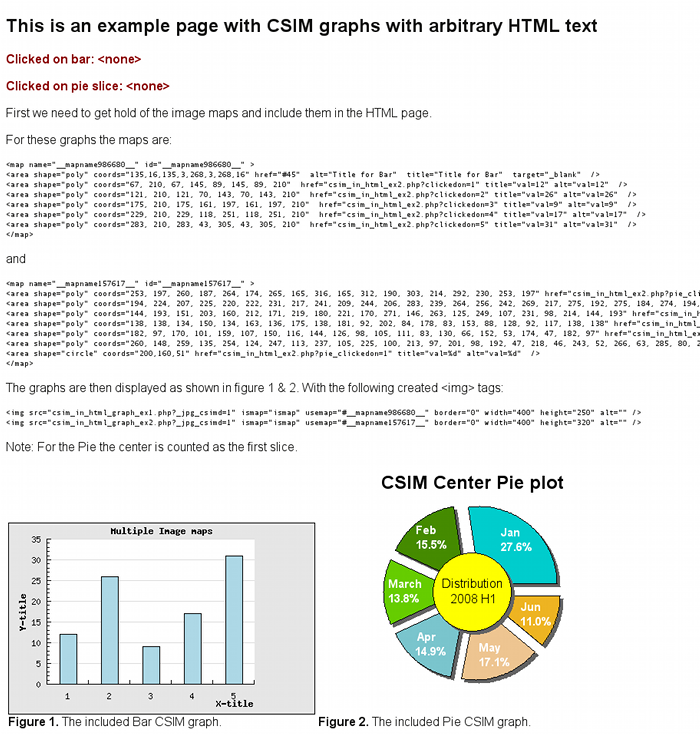
In Example 10.4. Example of HTML page that includes two Graph CSIM scripts
("Examples/csim_in_html_ex2.html") we show a complete HTML script that
includes two graphs, one bar (the same as in the previous example) and one Pie
graph. For illustrative purposes we use class PieGraphC variant
which is a Pie graph with a circular middle. The result of calling this HTML
page is shown in ??
Example 10.4. Example of HTML page that includes two Graph CSIM scripts
("Examples/csim_in_html_ex2.html")
1 2 3 4 5 6 7 8 9 10 11 12 13 14 15 16 17 18 19 20 21 22 23 24 25 26 27 28 29 30 31 32 33 34 35 36 37 38 39 40 41 42 43 44 45 46 47 48 49 50 51 52 53 54 55 56 57 58 59 60 61 62 63 64 65 66 67 68 69 70 71 72 73 74 75 76 77 78 79 80 81 82 83 84 85 86 87 88 89 90 91 92 93 94 95 96 97 98 99 100 | <html> <body> // The names of the graph scripts $_graphfilename1 = 'csim_in_html_graph_ex1.php'; $_graphfilename2 = 'csim_in_html_graph_ex2.php'; // This is the filename of this HTML file global $_wrapperfilename; $_wrapperfilename = basename (__FILE__); // Create a random mapname used to connect the image map with the image $_mapname1 = '__mapname'.rand(0,1000000).'__'; $_mapname2 = '__mapname'.rand(0,1000000).'__'; // Get the graph scripts require_once ($_graphfilename1); require_once ($_graphfilename2); // This line gets the image map and inserts it on the page $imgmap1 = $graph->GetHTMLImageMap($_mapname1); $imgmap2 = $piegraph->GetHTMLImageMap($_mapname2); echo $imgmap1; echo $imgmap2; <h2>This is an example page with CSIM graphs with arbitrary HTML text</h2> if( empty($_GET['clickedon']) ) { echo '<b style="color:darkred;">Clicked on bar: <none></b>'; } else { echo '<b style="color:darkred;">Clicked on bar: '.$_GET['clickedon'].'</b>'; } echo '<p />'; if( empty($_GET['pie_clickedon']) ) { echo '<b style="color:darkred;">Clicked on pie slice: <none></b>'; } else { echo '<b style="color:darkred;">Clicked on pie slice: '.$_GET['pie_clickedon'].'</b>'; } echo '<p />'; <p>First we need to get hold of the image maps and include them in the HTML page.</p> <p>For these graphs the maps are:</p> // The we display the image map as well echo '<small><pre>'.htmlentities($imgmap1).'</pre></small>'; <p> and </p> // The we display the image map as well echo '<small><pre>'.htmlentities($imgmap2).'</pre></small>'; // Construct the <img> tags for Figure 1 & 2 and rebuild the URL arguments $imgtag1 = $graph->GetCSIMImgHTML($_mapname1,$_graphfilename1); $imgtag2 = $piegraph->GetCSIMImgHTML($_mapname2,$_graphfilename2); <p>The graphs are then displayed as shown in figure 1 & 2. With the following created <img> tags:</p> <small><pre> echo htmlentities($imgtag1); echo htmlentities($imgtag2); </pre></small> <p> Note: For the Pie the center is counted as the first slice. </p> <p> <table border=0> <tr><td valign="bottom"> echo $imgtag1; <br><b>Figure 1. </b>The included Bar CSIM graph. </p> </td> <td valign="bottom"> echo $imgtag2; <br><b>Figure 2. </b>The included Pie CSIM graph. </p> </td> </tr> </table> </body> </html> |
Figure 10.2. Browser window after calling HTML page in Example 10.4. Example of HTML page that includes two Graph CSIM scripts
("Examples/csim_in_html_ex2.html") (Note: The image has been
scaled down to better fit this manual.)